After start some new instances, when we tried to view its Audit Trail or its Visual Flow, the new window that usually shows the process tree stayed loading for some time and, after that, showed the message "Unable to display Flowtrace and Faults due to an error while retrieving information from SOA, please review logs for more details".
Trying to find what could be happening, we found a thread of weblogic (at Environment > Servers > soa_serve1 > Monitoring > Threads) that remained executing for a long time and, after a defined timeout (600 sec), that thread got stuck. With some searches at Google and Metalink, we found an Oracle Doc (ID 972013.1 - EM Console Freezes when Viewing a Big Audit Trail in 11g) where a similar problem was described as a Bug (ID 9120676 - STUCK THREADS WHEN VIEWING AUDIT TRAIL IN 11G). As described by the Oracle Doc: "The problem comes during the UI rendering phase when we pre-expand audit trail tree nodes.It is hanging when iterating through recursive\nested 'while' loops for the tree pre-expansion.".
This issue is fixed in 11g PS2 - 11.1.1.3.0 (not available yet), but doesn't have a patch to the current version. As a workaround to view process audit trail and visual flow, you can do the following:
- Go to Enterprise Manager and Select the composite with the BPEL process you want to view.
- Instead of click on instance id of the composite at "Collapse Recent Instances" portlet of the dashboard, that usually would open the process tree view, search for your BPEL process at "Component Metrics" portlet of the dashboard and click on its name.
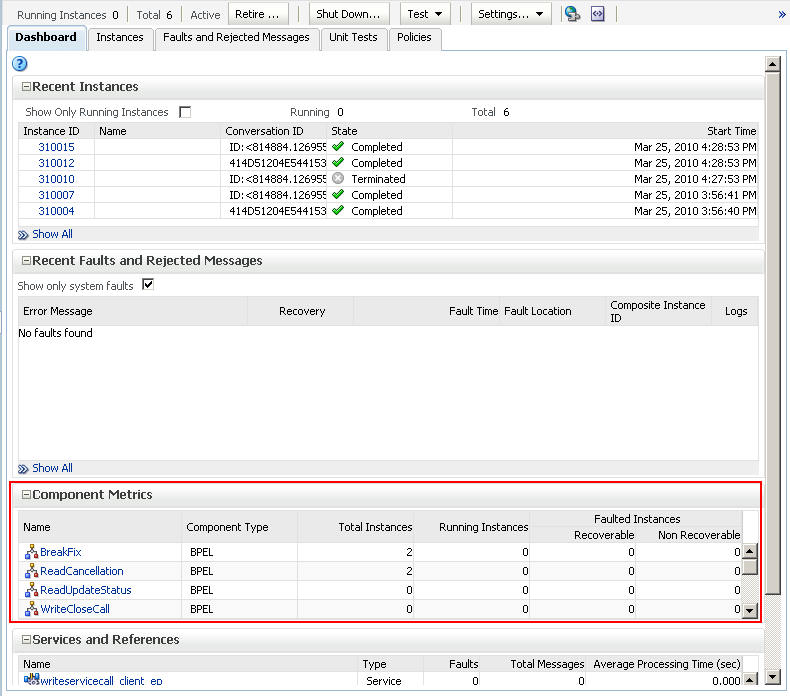
- The console will turn to the "Instances" tab ans will show just instances of the BPEL process, and not instances of the composite.

- Then, when you click on the instance id of a BPEL process instance, the new window will show the Audit Trail directly, instead of open the problematic process three view.

- Document ID 972013.1 - EM Console Freezes when Viewing a Big Audit Trail in 11g
- Bug ID 9120676 - STUCK THREADS WHEN VIEWING AUDIT TRAIL IN 11G


